Last November, we reported on median sales prices by town in Harrisonburg and Rockingham County. That is helpful for buyers who are deciding where to live in the local community, and sellers who might want a quick snap shot of the value of their home in the particular town in which they currently reside.
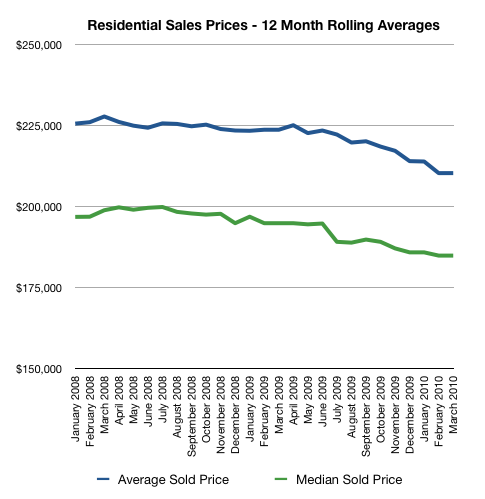
There are a multitude of ways to slice and dice data. One might find data by town helpful, and someone else might find an overall look at the market helpful. Well, we’ve decided to show you the 12-month rolling averages for Average Sales Price and Median Sales Price since 2008, and have thrown in a chart reflecting the total new listings during that same time as well.
As you can plainly see, prices have decreased gradually over time. In fact, average sales price has dropped 6.77% since January 2008, and median sales price has dropped 6.07%. This is not surprising, given the Great Recession that we have experienced. Although homeowners may find this data a bit unnerving, take heart in knowing that the market is warming up again (along with this gorgeous spring weather!).
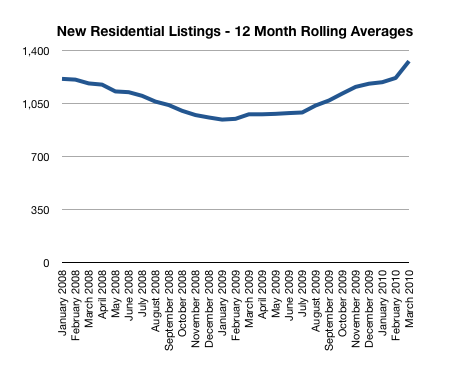
Here is a chart showing the total new residential listings from 2008 – (March) 2010:
Inventory is up! This is good news for home buyers, as they have lots to choose from, but it makes for a competitive market for sellers — another reason to use a competitive real estate team like ours (shameless plug). The local market inventory has increased by 9.62% since January 2008.
Keep an eye on our Market Trends posts to find out how our local real estate market is faring!


Pingback: Harrisonburg and Rockingham County Residential Real Estate Sales Price Trends