We’re well into the final quarter of 2010 already, can you believe it?! Remember last month when we reported the dire numbers of September? Well, the October numbers are in, and it is not completely positive, but not completely negative either. It feels as though we’re balancing on a tight rope and continue to hold somewhat steady, but occasionally quiver, making the rope bounce a bit. If we could just get to some stable ground, we’d feel much better about our real estate market. For now, we balance steadily and hold out hope for the future.
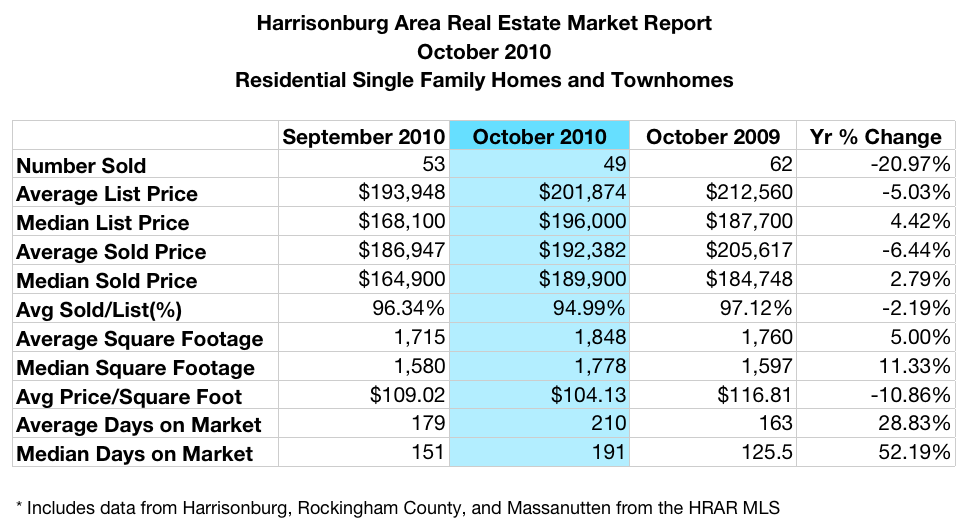
First, lets take a look at October 2010. Sales took quite a dip (-21%) compared to last year. The average list and sold prices were less than last year, but the median list and sold prices were more. Perhaps this is a sign that things are looking up? Also, the average sold/list percentage is now 95% compared to 97% from last October, which means that sellers are getting less and buyers are getting better deals. The homes people bought in October are larger (5% on average) this year than they were last year, and the price per square foot is less by almost 11%. Homes are also sitting on the market for longer periods of time, compared to last October.
Its not enough, though, to look at only monthly numbers because it is such a small snippet of time compared to the year-to-date statistics.
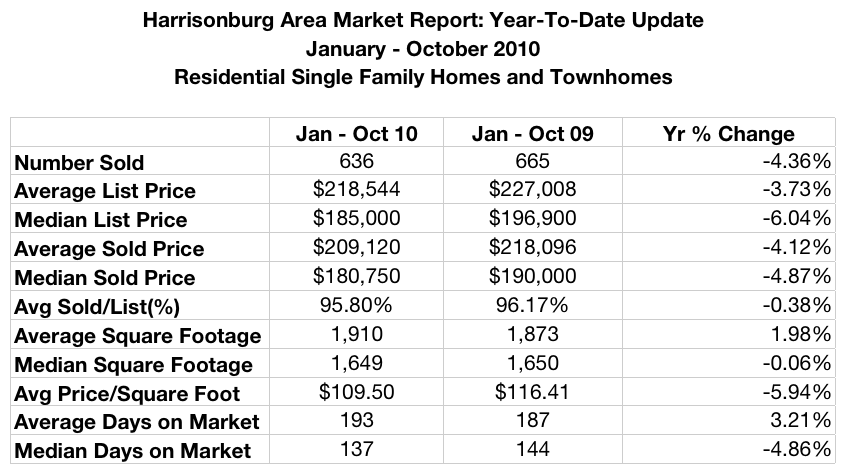
These numbers show a more true picture of the current market. Properties are still selling this year, but the number sold is down 4.36% from last year. Homes are also selling for between 4% and 5% less than last year at this time, and are sitting on the market for about the same amount of time. The average price per square foot has decreased by almost 6%, which buyers like and sellers hate. This means values have decreased since last year.
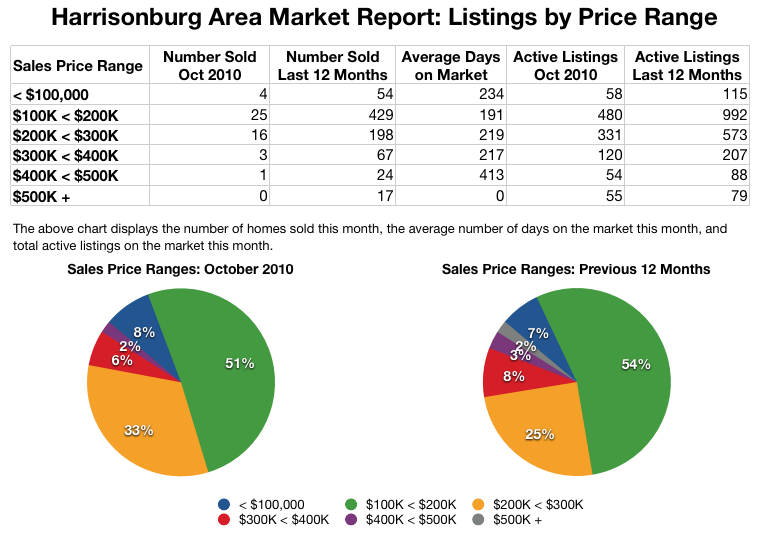
If you are interested in dissecting the data and looking at sales by price range, take a look at the chart above. Most homes are selling in the $100K – $200K range, followed closely by those in the $200K – $300K range. They are not selling too quickly, though, because the average days on market for these price ranges is 191 and 219, respectively. (That’s about 6 – 7 months.) As you can see from the active listings in October, there are a LOT of options out there for buyers. Inventory is very high, which should prompt sellers to really set their homes apart from the rest in a positive way to catch the attention of prospective buyers!
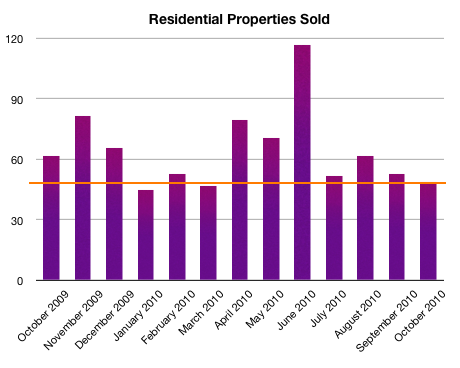
I’ve created an additional chart which highlights the number of sold properties over the past year [see below]. This helps in visualizing the state of the market (in terms of sold properties) for any given month of the year. Yes, sales are down compared to last year at this time, but we’re hopeful that the end of the calendar year will bring in more sales to help keep the market moving forward.
Stay tuned for next month’s report…


Pingback: Harrisonburg Area Real Estate Market Report: November 2010
Thanks for providing some good and useful information.
Pingback: Twitter Trackbacks for Harrisonburg Area Real Estate Market Report: October 2010 [harrisonblog.com] on Topsy.com