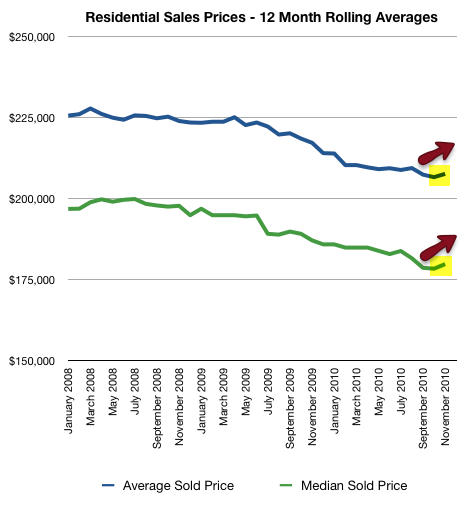
Last time we reported on the 12-month rolling averages for Average Sales Price and Median Sales Price, things were looking a bit bleak. The line graph looked more like a slide than a chart, starting high on the left and going low on the right. Lets take a look at this graph now, with the last several months worth of data entered into the chart.
Although this isn’t a breath of fresh air, it is certainly better than breathing in horribly potent fumes. Perhaps we’ve turned a corner? Maybe. Probably not. Don’t get your hopes up. I foresee our local real estate market continuing to waver a bit before turning a true corner and heading in a really positive direction. There are many variables thrown into the mix that don’t promote solidity in the market, such as interest rates (which are going to increase sooner than later).
Average sales price has decreased by 7.96% since January 2008, and median sales price has decreased by 8.66% since January 2008.
However, we are very happy to see any sort of positive data in this market! Only time will tell if the market will take a turn for the better. Stay tuned to keep tabs on our local market!


