We’re one-third of the way through the third quarter of 2011. Can you believe it?! Last month, we reported in the August Market Report that the gap in residential sales was closing from last year to this year (in July, the difference in YTD sales was -6%, in August it was -2%). Well, we have great news… September’s numbers are in, and that gap has closed and moved into the positive! Sales in 2011 are up 2.2% over 2010 so far. Lets take a look at some of the other stats below.
[Click any image below to view larger version]
See that statistic in the top right corner of the chart above? It says 2.2%. That is a positive number in the YTD change in residential sales over last year! We’ve seen the same number of sales occur in September as we did in August, so the YTD stat reflects a higher number of sales this September over last September. Price per square foot (or home value) is down by 7.4%, unfortunately. As of now, it rests at $101.76, whereas last year at this time, it was $109.93. This number is down because sales prices are down. Buyers aren’t having to pay as much for homes this year as they did in 2010, so sellers are getting less, and values are still declining.
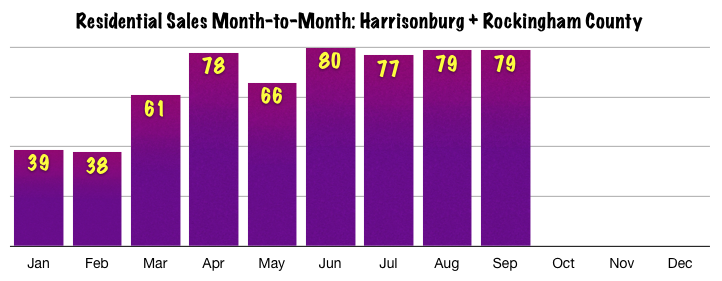
Above is a graphic showing how sales have occurred thus far in 2011, starting with just 39 sales in January, and moving up to 79 sales in September. We’ll likely see about the same number of sales in October as this past month, and then a decline in November and December as the holiday season sets in.
Contracts are also way up from last year at this time. We’ve seen an increase in contracts by 15.3%! This bodes well for the coming months as most of those contracts will close and be reflected in the sales charts later on. Comparing month-to-month, though, contracts are down quite a bit (21.2%). Folks are looking to buy larger homes this year, and those homes are sitting on the market for an average of 16 days longer.
As you can see in the graphic above, contracts held steady throughout the summer, and dropped in September. This is to be expected as fall usually comes with less production. The “busy season” for real estate is coming to a close, but we suspect we’ll see about the same number of contracts in October as we did in September, maybe a little less.
Stay tuned for next month’s market report! Until then, check out some other posts we’ve written about Market Trends…


Pingback: Harrisonburg Area Real Estate Market Report: October 2011