In September’s Market Report, we posted about the increase in sales over last year, and now in October’s Market Report, we’re happy to report that not only do year-to-date sales continue to increase, but the number of contracts also went up this month. An uptick in sales prices for October has spurred a less horrifying price difference from this year to last, too. Take a look at the October Market Report below, with a look at some fresh graphs we’ve developed. (More on that at a later date!)
[Click any image below to view larger version]
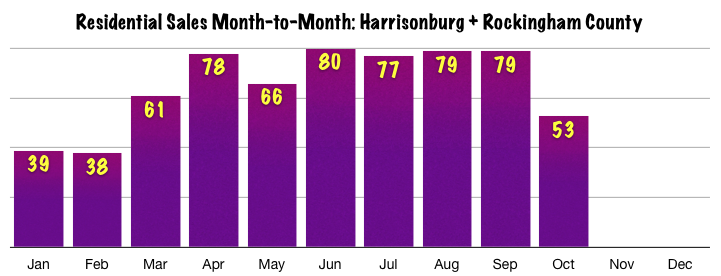
Sales. Sales are good for the local economy. It keeps money moving, and an increase in sales shows a sign of recovery. Sales from September to October were down significantly (-32.9%, to be exact), but that is to be expected. The fall and winter months often produce less sales than the rest of the year. The number we really want to keep track of is the year-to-date sales because it shows us the big picture. So, YTD sales has increased over 2010 by 2.7%. Yes, 2010 was a rough year, so it only seems natural that an increase would come this year. However, 2009 October sales were at 62, so we’re not too far off the mark.
Obviously, the peak selling season is spring through summer. Welcome to fall!
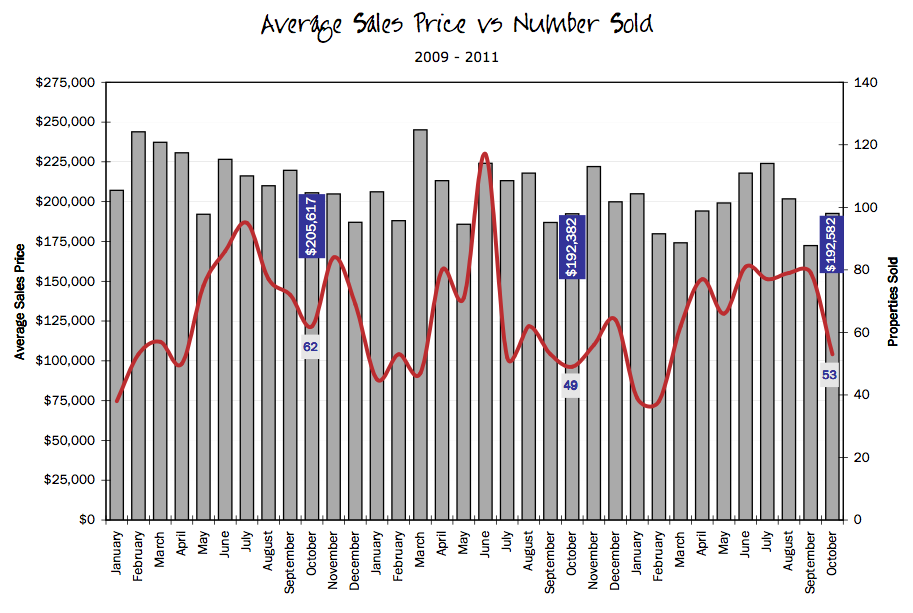
Above, you’ll see one of our new charts! This shows the average sales prices from January 2009 to present, and the respective number of homes sold during that time. Highlighted are the October stats.
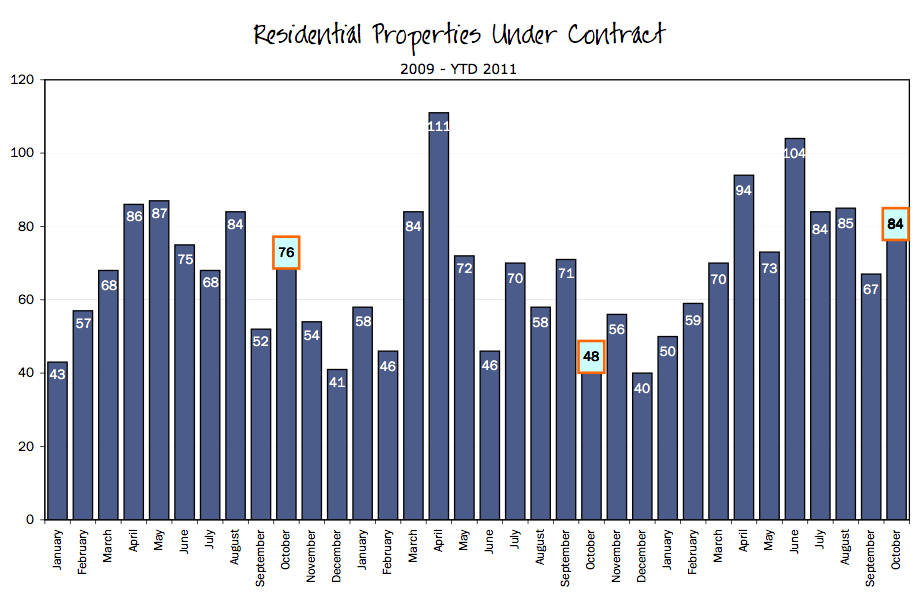
Contracts give us even more hope. Contracts are like the promise of sales. Not every contract turns into a sale, but a good bit of them do, and the fact that contracts continue to rise shows us that sales will continue to rise. Sellers, people are still buying! From September to October, contracts have increased by 25.4%, but again, that is really not a true comparison. The true comparison is with YTD contracts, which increased by 19.02% since last year. Now as with sales, comparing to a bad year (2010) will almost always produce favorable results. So, see below for a comparison to 2009…
In October of 2009, the Harrisonburg area saw 76 properties go under contract, whereas last month, there were 84. While we have to be careful about comparing just one month to another, it is good see this number move upward this year.
Above is a simpler look at the year 2011 and how many contracts each month has seen thus far. October contracts match July’s!
Stay tuned for more market trends and the November Market Report, delivered here on Harrisonblog.


Pingback: Harrisonburg Area Real Estate Market Report: November 2011