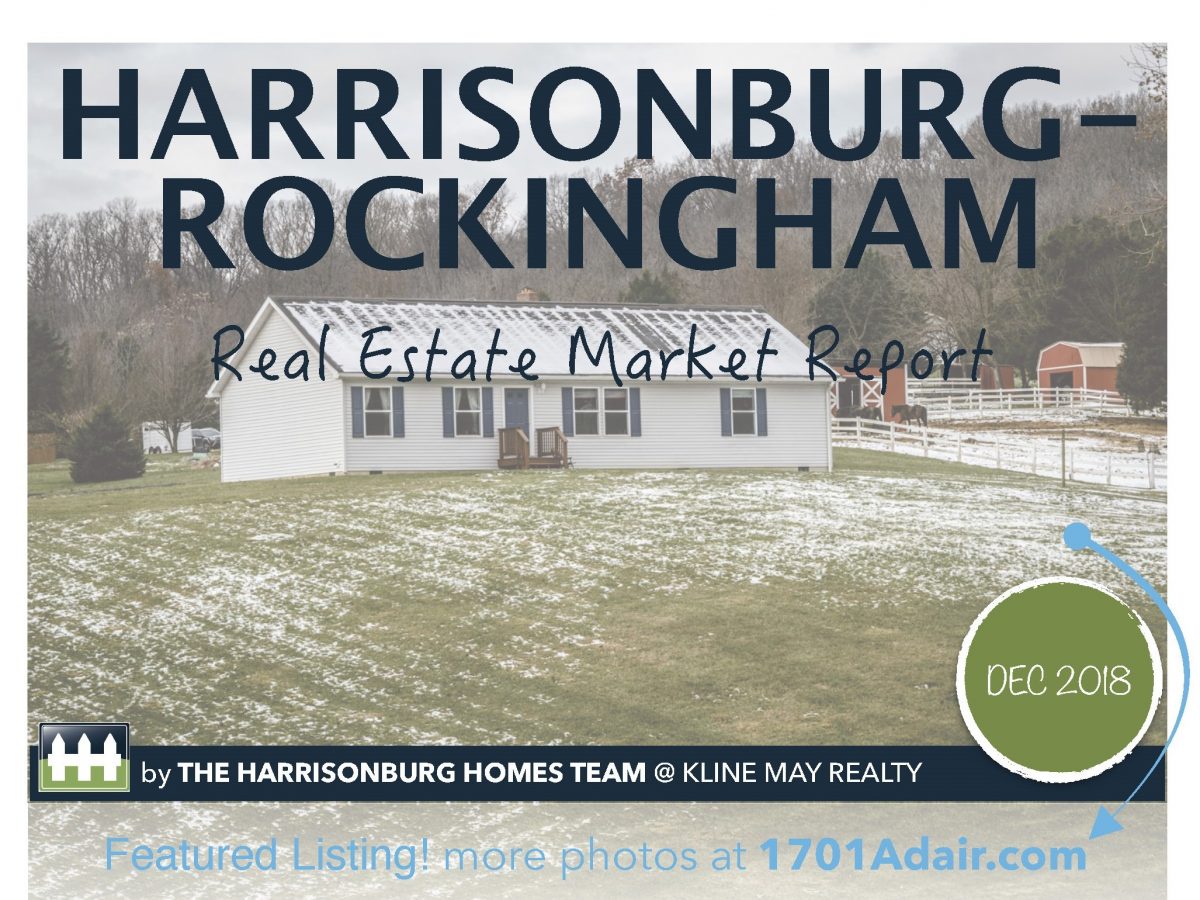
We’ve wrapped up another year in Real Estate! This year we’ve seen low inventory, our average days on market have dropped drastically (down 29%) and our prices have risen ($212,000 as compared to $198,250 in 2017)! Houses are hitting the market, going under contract quickly, and for more money (up 6% from last year, averaging $123 for the price per square foot)! Learn more about our Market Report! >>>
Market Trends
Harrisonburg Real Estate Market Report: November 2018 [INFOGRAPHIC]
New listings are up by 10% in November as compared to last year. In addition, the year-to-date and rolling month averages for new listings have both increased slightly as compared to last year. However, we are seeing sales dropping off (down 17% from last November). The average days on market is continuing to drop drastically by 24% from last November, and 17% year-to-date. The average price per square foot is continuing to rise across the board. Read more...
Harrisonburg Real Estate Market Report: October 2018 [INFOGRAPHIC]
We can't believe it's November already - 2018 is starting to wind down! New listings are up by 20% in October as compared to last year. In addition, the year-to-date and rolling month averages for new listings have both increased slightly as compared to last year. However, we are seeing fewer pending sales (down 5% from last October). The average days on market is continuing to drop by 5% from last October, and 17% year-to-date. Read more...
Harrisonburg Real Estate Market Report: September 2018 [INFOGRAPHIC]
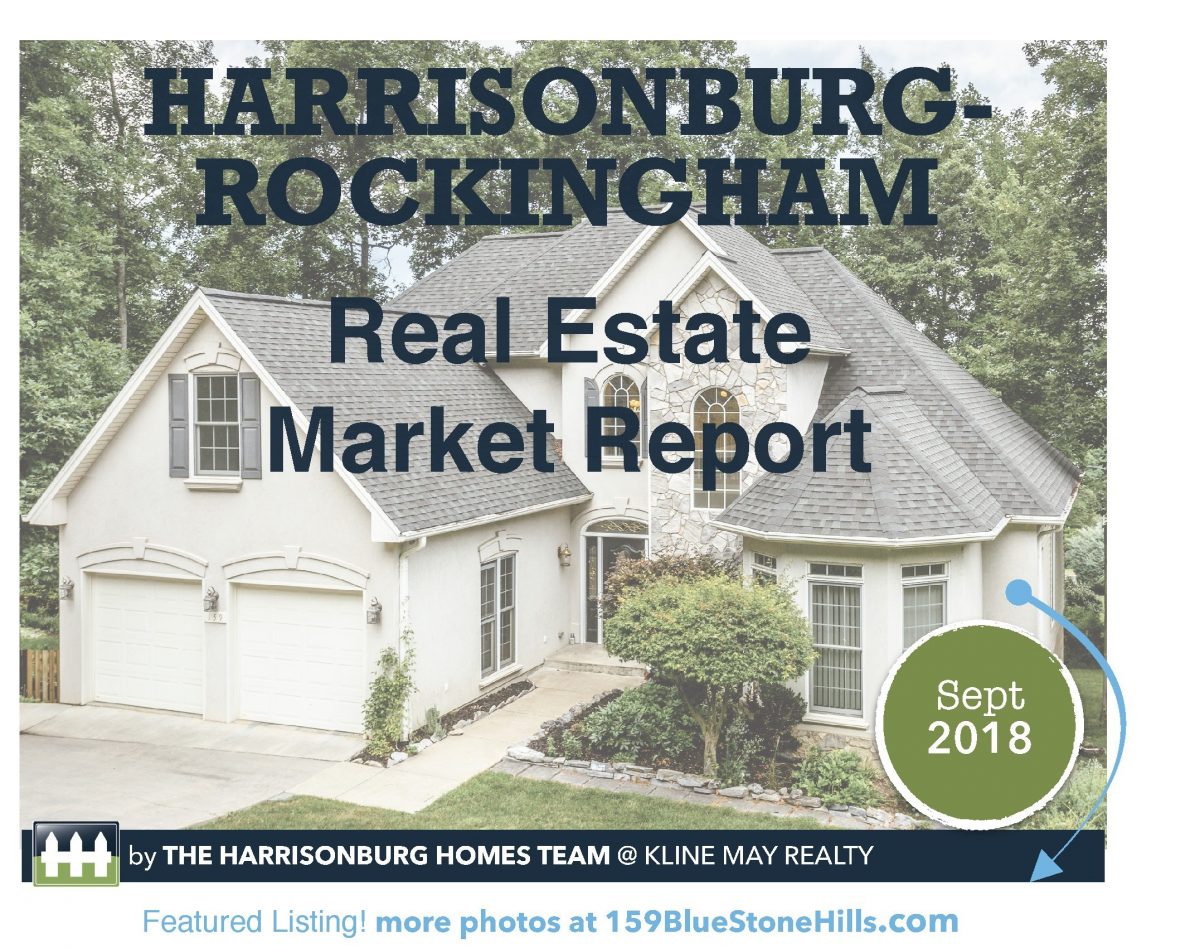
The leaves are starting to change and scarves and jackets are appearing - it must be Fall! New listings and sales have started to slow, but the average price per square foot has shot up by 14% ($133) as compared to last September. The average days on market is continuing to drop by 4% from last September, and 21% year-to-date. The median sales price is on the upswing and comes in at $212,000 (up 8% from $195,500 last year). Read on to learn more about the September 2018 Market Report!
Harrisonburg Real Estate Market Report: August 2018 [INFOGRAPHIC]
We are seeing a surge in new listings in August (up 14% as compared to August 2017). However, we are seeing sales slow in the same period (10% lower than last August). The average days on market continue to drop drastically and the average price per square foot has also continued to rise from $112 last August to $124 this August. The median sales price is also on the upswing and sits at $210,000. Read on to learn more about the August 2018 Market Report!
Harrisonburg Real Estate Market Report: July 2018 [INFOGRAPHIC]
Pending listings have shot up to 139 in July, which is 19% more than last July. New listings have fallen slightly (but only by 3%), however the average days on market continue to drop (down 9% from last year) and the average price per square foot is on the upswing by 6% as compared to year-to-date 2017. The median sales price has shot up to $210,000 - 8% from 2017! Read on to learn more about the July 218 Market Report!


