We're seeing a decrease in new listings and sales as compared to last May, and a rise in median days on market. We're down 20% for homes that went under contract within 30 days, as compared to the previous year. View more of the market report >>>
Market Trends
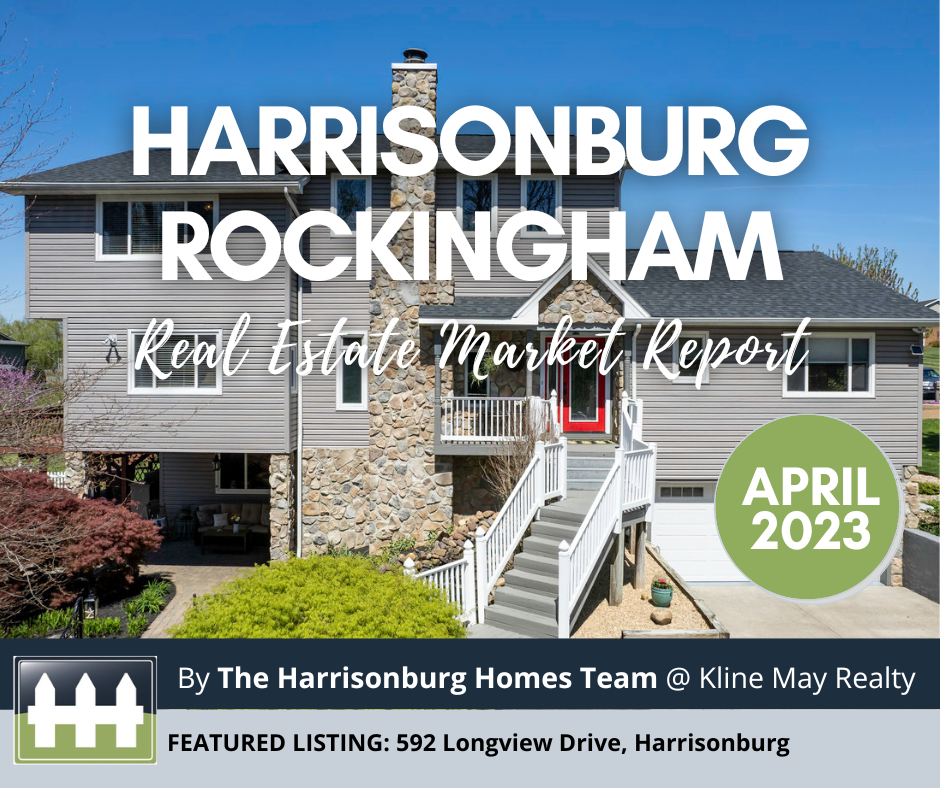
Harrisonburg Real Estate Market Report: April 2023 [INFOGRAPHIC]
We're continuing 2023 with a decrease in new listings and sales as compared to last April, and a slight rise in median days on market. We're down 17% for homes that went under contract within 30 days, as compared to the previous year. View more of the market report >>>
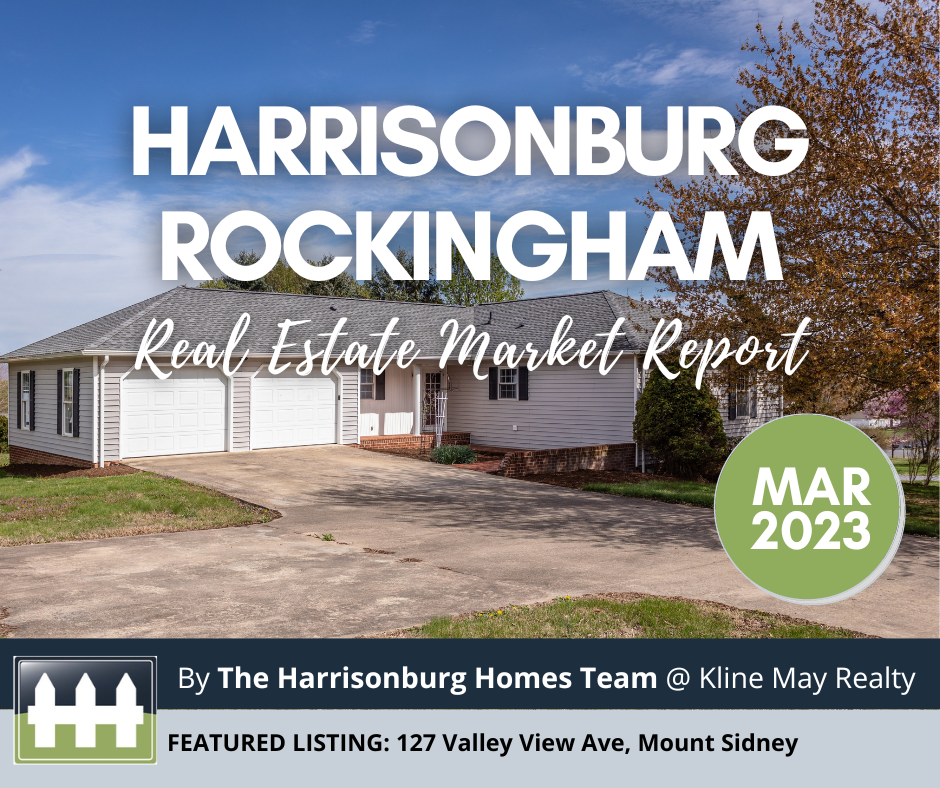
Harrisonburg Real Estate Market Report: March 2023 [INFOGRAPHIC]
We're continuing 2023 with a decrease in new listings and sales as compared to last March. We've passed the 300K mark for median sales price, and are holding steady on the 11% increase from last year. View more of the market report >>>
Harrisonburg Real Estate Market Report: February 2023 [INFOGRAPHIC]
We're continuing 2023 with a decrease in new listings and sales as compared to last February. We've passed the 300K mark for median sales price, and are holding steady on the 10% increase from last year. View more of the market report >>>
Harrisonburg Real Estate Market Report: January 2023 [INFOGRAPHIC]
We're starting 2023 off with a decrease in new listings and sales as compared to last January. However, the amount of pending listings only fell 2% from last year. We've passed the 300K mark for median sales price, and are holding steady on the 11% increase from last year. View more of the market report >>>
Harrisonburg Real Estate Market Report: December 2022 [INFOGRAPHIC]
As compared to last December, we saw a sharp decrease in new listings, sales, and contracts. However, the average price per square feet has risen by 11% as compared to the previous 12 months. The median sales price for the area is just under 300K at $299,925, up 11% from last year. View more of the market report >>>


