We've seen an increase of new listings this May (18% up from last May) and the average days on market continue to drop across the board. 1160 homes went under contract within 30 days (last 12 months) - that's 39% up from last year. 30% of total sales in the last 12 months were over final asking price. View more of the market report >>>
Market Trends
Harrisonburg Real Estate Market Report: April 2021 [INFOGRAPHIC]
We've seen an increase of new listings this April (10% up from last April) and the average days on market continue to drop. Inventory is still low, and 451 homes sold over asking price in the last 12 months. View more of the market report >>>
Harrisonburg Real Estate Market Report: March 2021 [INFOGRAPHIC]
Taking a look at the last 12 months, listings are down by 48% from the previous 12-month period. However, sales are on the uptick with 13% more sales in the last 12 months. The average days on market continue to fall and the price per square foot is rising. View more of the market report >>>
Harrisonburg Real Estate Market Report: January 2021 [INFOGRAPHIC]
We saw 123 new listings in January (that's up 17% from last January!). The average days on market continue to drop and are down to 46 days, and the average price per square foot has risen to $150. 1060 homes went under contract in 30 days or fewer, which is a 31% increase from last year. View more of the market report >>>
Harrisonburg Real Estate Market Report: December 2020 [INFOGRAPHIC]
What a year 2020 was! For 2020, the average days on market dropped by 28% to just 43 days. The price per square foot continues to rise (a 9% increase from 2019). 1036 homes went under contract within 30 days of being on the market - that's a 33% increase from last year! View more of the market report >>>
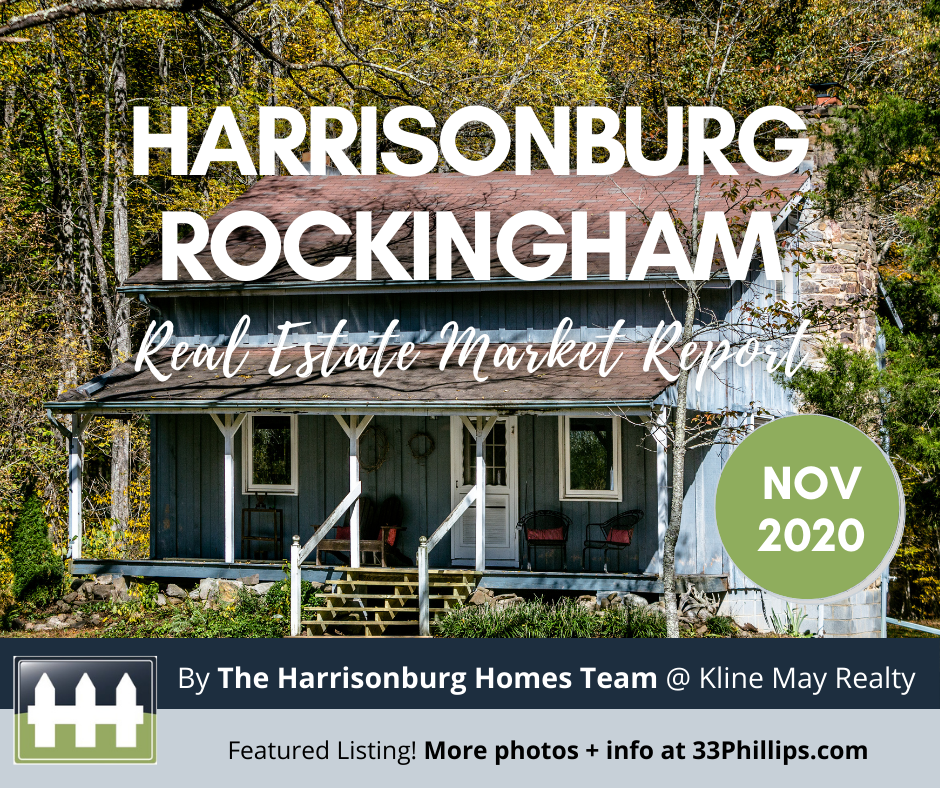
Harrisonburg Real Estate Market Report: November 2020 [INFOGRAPHIC]
Check out November's market report! We've seen a jump in new listings in November (up 54% from last November). 24% of sales in the past 12 months sold over asking price. Days on Market continue to drop and the average price per square foot is rising. The median sold price is 10% higher than last year at an even $242,000. View more of the market report >>>


